How can we rely on AI?
Statisticians from HITS, KIT, and Heidelberg University introduce the new “CORP” approach to better determine the reliability of forecasting methods. CORP also has an impact on machine-learning methods in general. The paper was published in the Proceedings of the National Academy of Sciences (PNAS).

Today, we are used to checking the weather app on our smartphone before we leave the house. If it says, “There is a 60% chance of rain,” we take an umbrella. But how reliable are these forecasts? And can we also apply probabilistic methods to other types of forecasts, such as for economic development? For example, precipitation forecasts in tropical Africa tend to be unreliable – a major concern for farmers who run the risk of losing their harvest. In order to improve forecasting methods, it is essential to have stable and trustworthy diagnostic tools that help to identify existing shortcomings.
More stable, more efficient: The CORP approach
With these questions in mind and inspired by a recent study on precipitation forecasts for northern tropical Africa, statistician Tilmann Gneiting and members of the Computational Statistics group at the Heidelberg Institute for Theoretical Studies (HITS) developed a new approach that enriches the toolbox of forecast evaluation. In a newly published PNAS paper, the authors introduced “CORP” (a Consistent, Optimally binned, and Reproducible reliability diagram that uses the Pool-adjacent-violators (PAV) algorithm): The approach yields improved graphical tools (“CORP reliability diagrams”) that are more stable and efficient than the classical type of diagram, which has been used for decades.
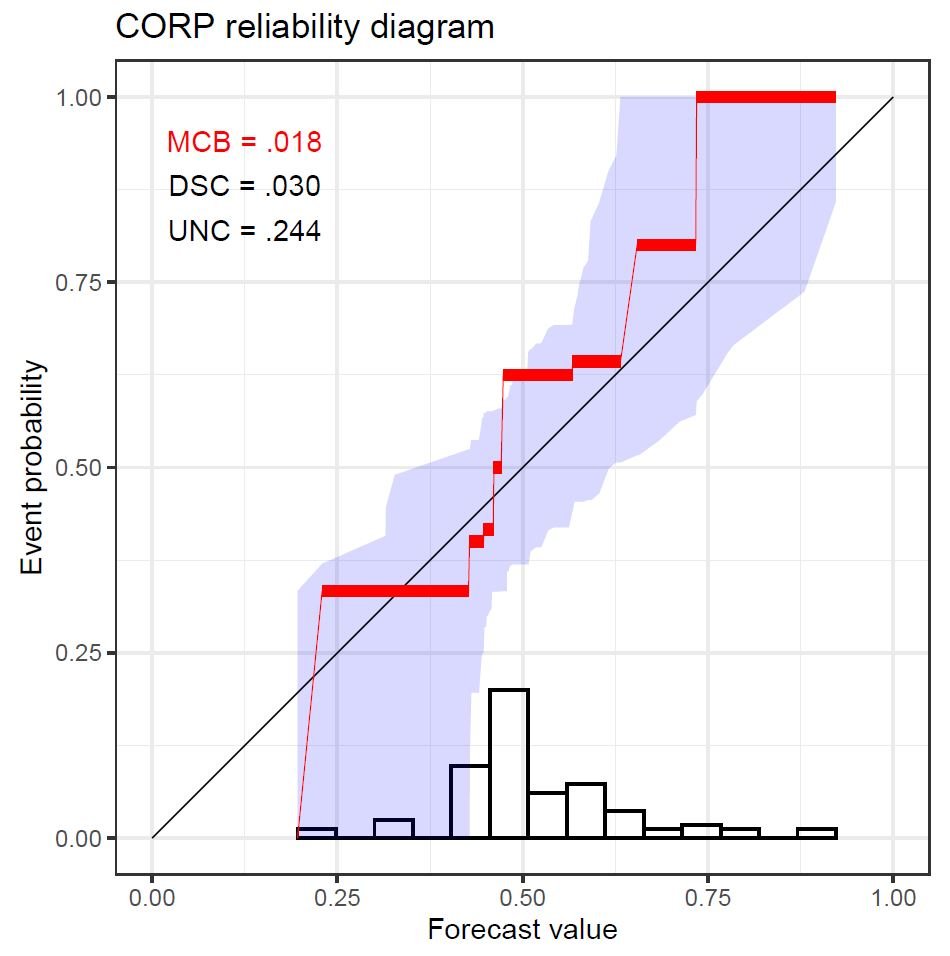
Calibration or reliability is essential to any probability forecast or probabilistic classifier. The classifier is calibrated or reliable if the predictions are statistically consistent with the outcomes. For example, for cases that have a predictive probability of about 80%, the observed event frequency should also be about 80%. “In practice, calibration is assessed graphically in reliability diagrams, and quantified via the reliability component of mean scores,” says co-author Alexander Jordan (HITS). For many decades, researchers and practitioners have checked calibration in myriads of applications, with a recent surge of interest owing to the fundamental role of classification problems in artificial intelligence (AI) and machine learning. Existing approaches to plotting reliability diagrams rely on binning and counting and have been hampered by ad hoc implementation decisions, a lack of reproducibility, and inefficiency.
Real-world problems and mathematical methods: A fruitful interdisciplinary approach
The new CORP approach yields graphical checks of whether probability forecasts are reliable. CORP is based on the classical PAV algorithm, which was proposed nearly 70 years ago. The approach allows for uncertainty quantification and furnishes a new numerical measure of miscalibration. To illustrate the new tools, the study uses experimental datasets not only from meteorology, but also from astrophysics, social science, and economics. For instance, the authors evaluated probability forecasts of recessions in the U.S. gross domestic product (GDP). “In contrast to the binning and counting approach, the CORP reliability diagram proved to be more stable, even for challenging forecasting problems with high estimation uncertainty,” first author Timo Dimitriadis (now Assistant Professor in Applied Econometrics at Heidelberg University) summarizes.
Tilmann Gneiting, who is also Professor of Computational Statistics at the Karlsruhe Institute of Technology (KIT), where he serves on the steering committee of the Center for Mathematics in Sciences, Engineering, and Economics (MathSEE), stresses the mutual benefits of interdisciplinary research, as showcased through this study: “Mathematical and statistical methods serve as tools for solving important real-world problems, whereas important real-world problems inspire new methodological developments in the mathematical sciences.”
In their conclusion, the authors state their expectation that judicious uses of the PAV algorithm will yield improved tools for diagnostics and inference for a very wide range of statistical and machine-learning methods. The article was published in the Proceedings of the National Academy of Sciences of the United States of America (PNAS) on 23 February 2021.
Timo Dimitriadis, Tilmann Gneiting, and Alexander I. Jordan: Stable reliability diagrams for probabilistic classifiers, PNAS, February 23, 2021 118 (8) https://doi.org/10.1073/pnas.2016191118
About HITS
HITS, the Heidelberg Institute for Theoretical Studies, was established in 2010 by physicist and SAP co-founder Klaus Tschira (1940-2015) and the Klaus Tschira Foundation as a private, non-profit research institute. HITS conducts basic research in the natural, mathematical, and computer sciences. Major research directions include complex simulations across scales, making sense of data, and enabling science via computational research. Application areas range from molecular biology to astrophysics. An essential characteristic of the Institute is interdisciplinarity, implemented in numerous cross-group and cross-disciplinary projects. The base funding of HITS is provided by the Klaus Tschira Foundation.